Master Stock Trading with Trade Guru Arvind

Join our expert-led courses in stock and forex trading today!

Expert Trading Courses

Join our top stock market institute for comprehensive courses in Indian and forex markets.

A hand holds a smartphone displaying a financial chart with candlestick patterns. In the background, a large, similar financial graph is visible on a screen, featuring fluctuating lines and data points.
Forex Market Training

Learn forex trading strategies from our expert trainer, Arvind Ghadge, the Forex King.

Stock Market Courses

Master stock trading with our expert-led courses tailored for all skill levels.

Comprehensive Learning

Gain in-depth knowledge of trading with our structured courses and expert guidance.

woman wearing yellow long-sleeved dress under white clouds and blue sky during daytime

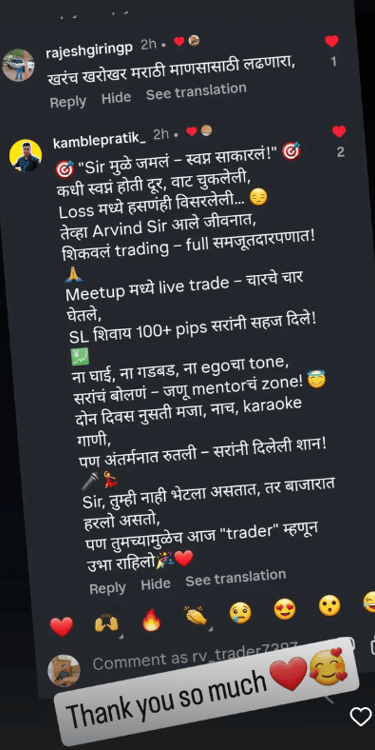
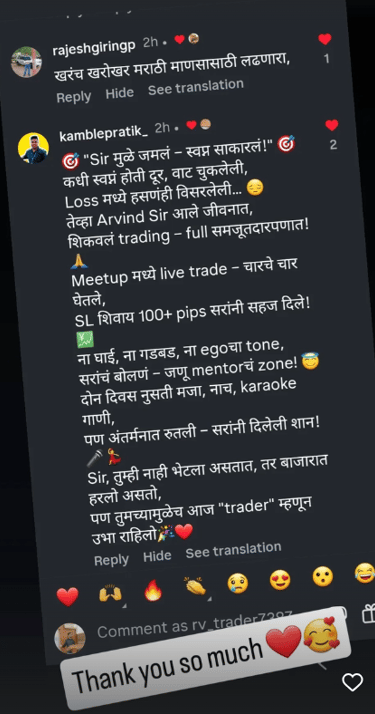
Trade Guru Arvind transformed my trading skills. Highly recommend their courses for stock and forex markets!

Rajesh Kumar

A laptop displaying a stock market graph with a rising trend is placed on a desk. Next to the laptop are several books stacked on each other, with titles related to investing. A mouse is positioned to the right of the laptop.

The training at Trade Guru is exceptional. Arvind's expertise in forex is truly unmatched and inspiring.

Sneha Patel

Hands typing on a laptop keyboard with a screen displaying financial graphs and stock market data. Multiple charts and numbers are visible, indicating online trading or financial analysis.
★★★★★
★★★★★

Market Mastery

Explore our courses in stock and forex trading excellence.

A computer monitor displays a cryptocurrency exchange interface with various graphs, charts, and numerical data. On the left side, there are options for buying and selling, as well as a list of recent trades. The main graph on the right shows a price chart with a candlestick pattern, indicating fluctuations in the market over a period of time.
A digital financial chart with green and red zigzag lines on a dark background, representing market trends. Below the main graph, there are smaller charts featuring bar indicators in red and blue, along with a yellow line graph.
A person is holding a smartphone displaying a financial trading app. The screen shows a candlestick chart with various trading metrics, including the current price, percentage changes, and buttons for different actions. The person's hands are visible, and a black background accentuates the smartphone screen.
A hand holding a smartphone displaying a colorful line graph with various candlestick patterns, indicative of financial or stock market data. The background consists of a textured, woven fabric surface in neutral tones.